Speech Resources Metrics and Usage Monitoring
Druid provides real-time analytics and metric dashboards to track performance, usage volume, and response latencies across all speech services used in the Druid SIP channel. This allows administrators to monitor service level agreements (SLAs), detect latency bottlenecks, and audit resource consumption.
Access speech resource metrics
You can inspect speech resource metrics through two primary views:
- Global metrics. Navigate to Administration > Speech Resources and click the Metrics tab.
- Individual resource metrics. Navigate to Administration > Speech Resources and on the Resources page, click the Preview icon in line with the resource. The page opens the Metrics tab filtered specifically for that selected resource.
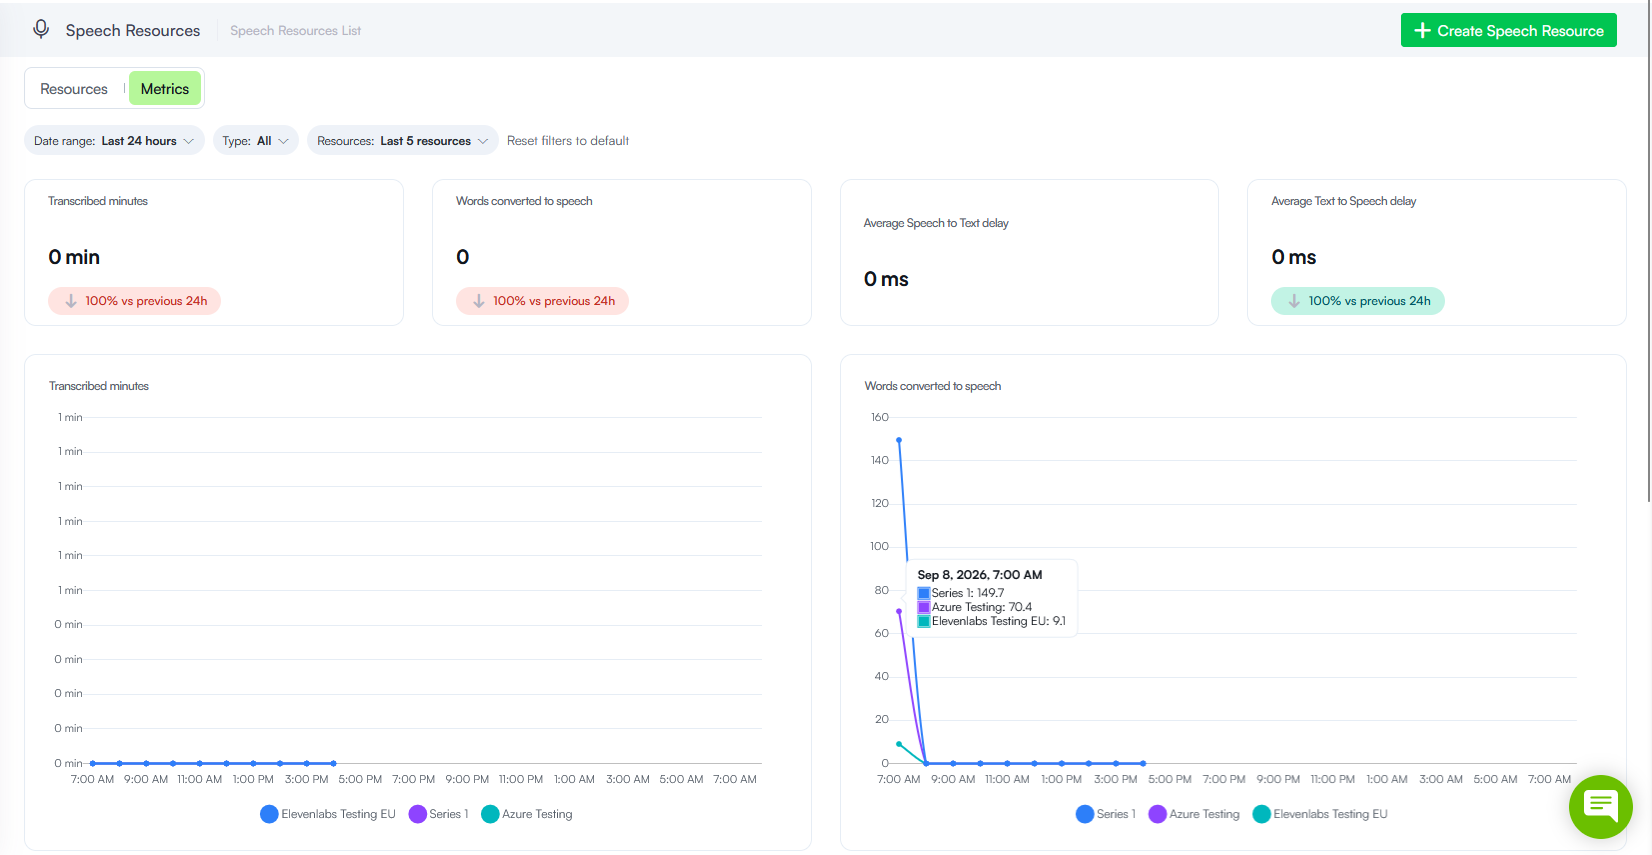
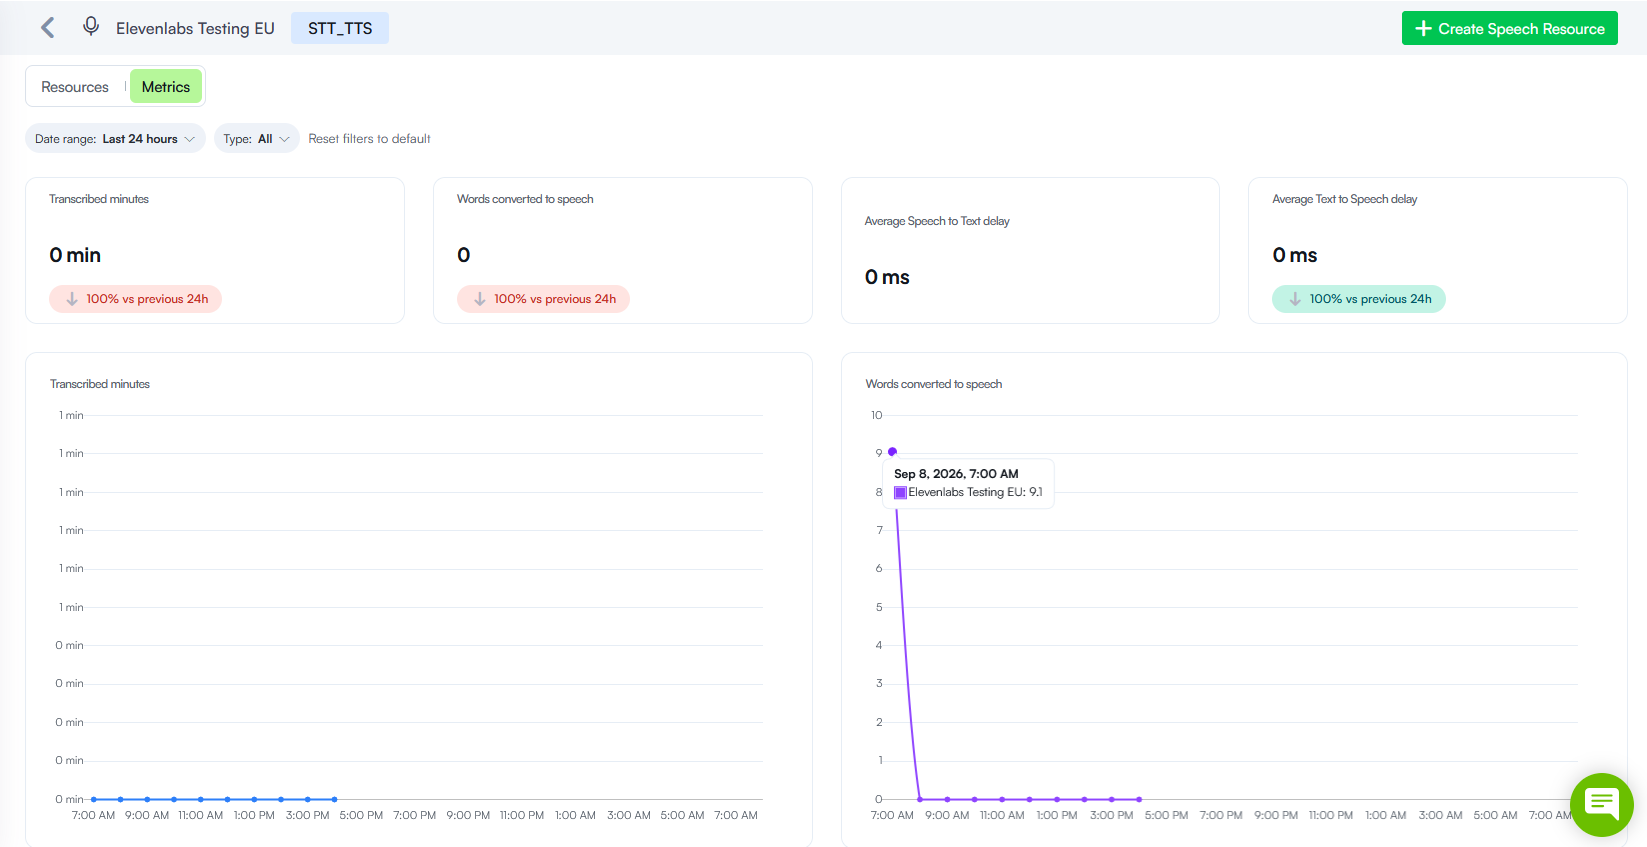
At the top of the Metrics dashboard, you can customize the displayed dataset:
- Date range: Select time horizons (e.g., Last 24 hours, Last 7 days, or custom ranges).
- Type: Filter metrics by capability (All, STT, or TTS).
- Resources: Filter by specific resources.
- Reset filters to default: Resets all filters back to the default past 24-hour view.
Metrics reference
The Metrics dashboard contains four summary KPI cards at the top and four charts.
Summary KPIs
| KPI | Unit | Description |
|---|---|---|
| Transcribed minutes | Minutes (min) | otal volume of voice input transcribed into text by Speech-to-Text (STT) services during the selected period. Shows percentage comparison vs. previous period. |
| Words converted to speech | Word count | otal count of words synthesized into audio by Text-to-Speech (TTS) services. Displays percentage variance relative to previous timeframe. |
| Average Speech to Text delay | Milliseconds (ms) | Measures average latency/response time for STT processing from voice capture to text delivery. |
| Average Text to Speech delay | Milliseconds (ms) | Measures average latency for generating TTS audio synthesis. Essential for monitoring real-time voice responsiveness in Druid SIP channels. |
Detailed Analytics & Visual Trend Charts
Below the KPI summary cards, four interactive line charts plot usage volume and response latency over time, enabling side-by-side comparative analysis across providers.
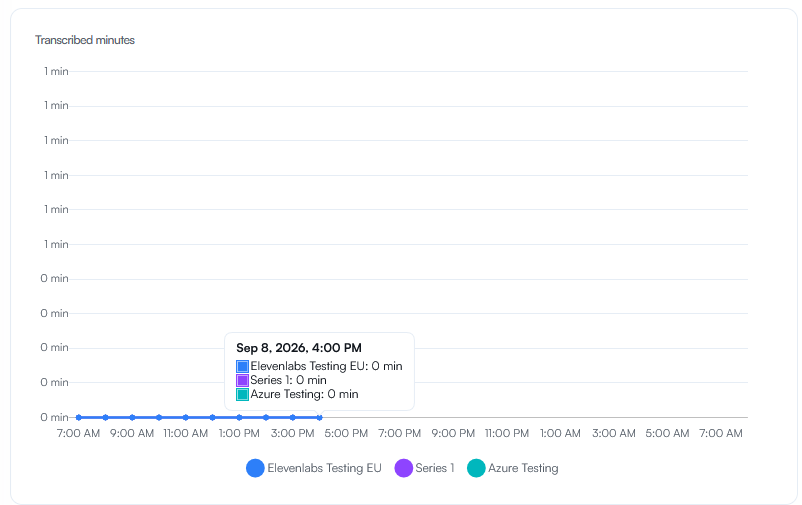
Transcribed Minutes Trend Chart
This chart shows transcribed audio volume over time per hour or selected interval. Each active resource is color-coded, allowing you to compare STT load distribution across providers at a glance.
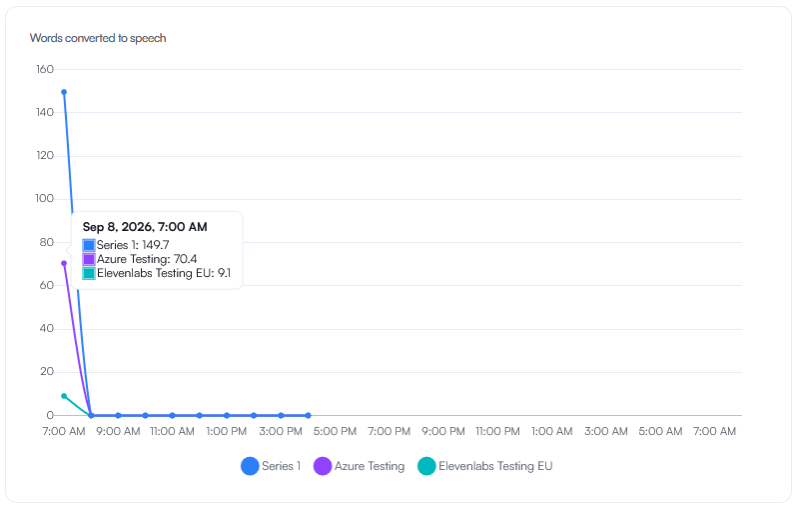
Words Converted to Speech Trend Chart
This chart shows TTS synthesis activity over time to help track output volume spikes across Druid SIP voice interactions.
Average Speech-to-Text Delay Trend Chart
This chart tracks STT service response latency in milliseconds across the selected timeframe. Monitoring latency fluctuations helps teams identify provider slowdowns, API rate-limiting, or regional network bottlenecks.
Average Text-to-Speech Delay Trend Chart
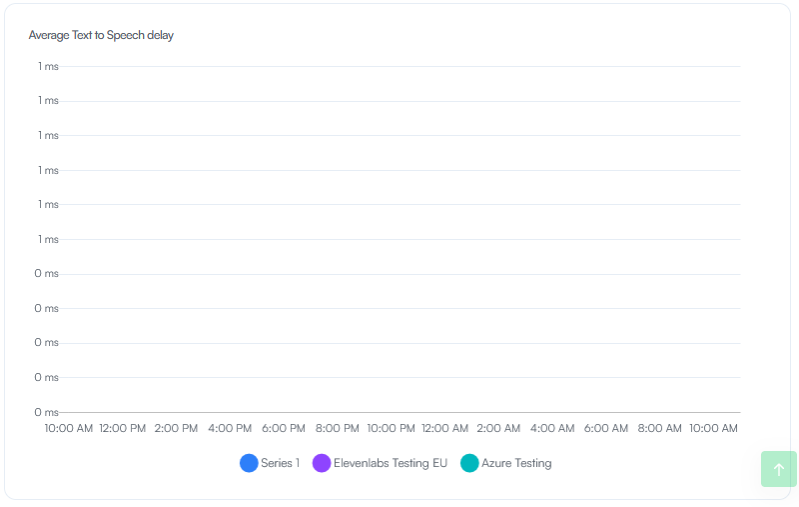
This chart measures TTS audio generation latency per resource over time, enabling performance benchmarking between different synthesis models (such as ElevenLabs versus Azure).